Create a personalized analytics dashboard to drive business
The sky is the limit with business intelligence fueled by smart data from all your market sectors. Power BI and Treasure Data unite in the cloud to produce visionary reporting that could change how you go to market — and stay there. Imagine integrating the data found in the various platforms that your organization uses, then slicing and dicing it into analytical reporting to improve organizational decision making. Faster processing of larger data loads means you’ll have all the information you need to make spot-on business decisions.
Power BI’s expressive self-service data visualization tools make your point in entirely new and engaging ways. This is power lifting at its finest, merging front-end ease of use with back-end core processing of all your integrated data across multiple platforms. Together, Treasure Data and Power BI leverage your business data in new ways to give you actionable insights in real time.
Use Cases
Create Intelligent Business Reporting
Meld all disparate data into one laser-focused reporting mechanism to gain better insight for your business.
Automate Report Distribution across Devices
Automatically or manually share data visualization-fueled reporting to any user on their preferred digital device.
Absorb and Analyze Multi-source Data
Go big picture or deep dive with Treasure Data as the integrator and Power BI as the intelligent deconstruction tool.
Combine and Monetize Your Data
Power BI + Big Picture Data
Use Power BI to visually explore all of the data sources linked to the Treasure Data Customer Data Platform.
• • •
Understand big picture data by integrating all information sources and then combining them in entirely new was to gain insight.
Power BI + Expanded Reach
Go global by viewing an expansive array of KPIs or other benchmarks across a landscape of data sources.
• • •
Custom analytical dashboards help you find the insight you need when you need it the most.
Power BI + Better UX
The point of Power BI is visualization and this software delivers on the promise by making data interesting and insightful.
• • •
Drag and drop, apply data filters, change colors and values or show different data combinations to engage stakeholders.
How it Works
![]()
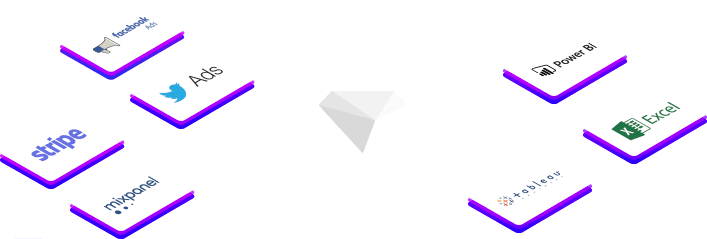
Connect
Enable Power BI Data Connector with a simple, 3 minute setup.
![]()
Unify and Analyze
Analyze your Power BI data beyond what’s possible in Power BI reporting with a few lines of SQL.
Treasure Data brings increased sources of data to the Power BI analytical tool, processing it faster than ever before.
How it Works
![]()
Automate
Use Treasure workflow to automate your analysis, save time and minimize errors. No more Excel work on Sunday before the Monday team meeting.
Available Power BI Data
![]()
Available Power BI data includes: Downloads, revenues, usage, demographics and more.
![]()
Power BI custom reports include: Configurable dashboard windows for any data.
You're in good company
Treasure Data’s solutions are used by 4 of the 5 largest global tech companies with proven scale in managing more than 200 million events per second. These brands are a few of the happy customers who count on our complete and innovative data solutions to grow their business.
Talk with our experts
We understand that no two companies operate alike. Our professional services team can help you configure a self-managed solution that meets your budget. Our highly attentive technical support staff is always on hand whenever you need assistance.