Routing Data from Docker to Prometheus Server via Fluentd
Last updated July 19, 2016See the video of the full integration here: https://www.youtube.com/watch?v=uyu-GeAM-xk&feature=youtu.be
Possibly the best way to build an economy of scale around your framework, whatever it is, is to build up your library of integrations – or integrators – and see what and who your new partners can bring into the mix.
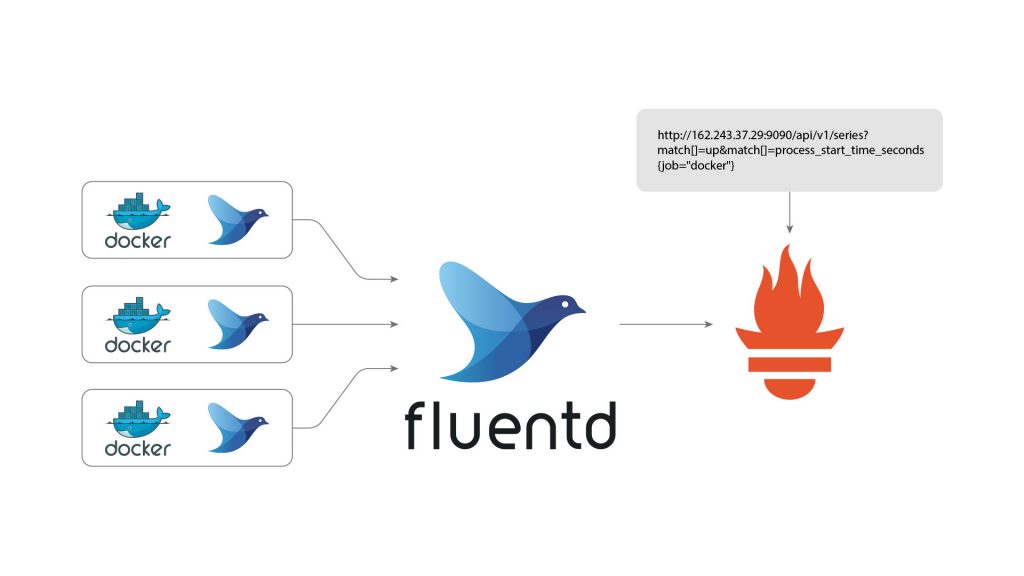
In this blog, we’ll trace the steps to connect Fluentd to a Docker container to route stdout commands (our data) to Prometheus. (Prometheus could be similarly configured on Google Cloud Platform, CoreOS or even Kubernetes). Later, we’ll also query Prometheus for that data.
When Treasure Data joined The Cloud Native Computing Foundation (CNCF), not only did it reinforce its commitment to drive Fluentd towards mainstream use as a logging framework, it also renewed its existing commitment to using Fluentd as an integration point between cloud native software like Kubernetes, Prometheus and Docker.

Originally started at Soundcloud around 2013 by an engineer taking a break from Google, Prometheus was a result of frustration that other monitoring tools (and time-series database integrations) weren’t quite up to snuff.
While monitoring is essential to any IT organization; once these orgs were creating microservice-style applications and distributing them across literally thousands of bare-metal or virtualized server instances (or even more containers), other tools were found to be insufficient to handle, among other things, the incrementalism and scalability of this approach. Thus, even Ganglia (then in use at Facebook) and Nagios (in use at the time at Google) were coming up short.
Soundcloud, a Berlin, Germany – based audio streaming service, was also having their own issues with StatsD and Graphite monitoring tools when Google’s Matt Proud joined to build up the Prometheus project. Added by Google to the Kubernetes project in May of 2015 (after its coming out party that prior January), Matt Proud started the Prometheus project ‘to apply empirical rigor to large-scale industrial experimentation’, among other things.
So what is Prometheus?
Prometheus is an open-source monitoring system and time-series database. Written in Go language, Prometheus is a natural member of the ecosystem around CNCF, (and is officially being incubated there), due in parts to its design toward scalability and extensibility: Prometheus is not just for monitoring Kubernetes applications; it also works for those in Mesos, Docker, OpenStack and other things.
Primarily a monitoring tool, Prometheus includes a time-series database and a query system. However it was designed to be extended with a larger datastore as needed. Given that it supports a range of other datastores to this end (including Cassandra, Riak, Google Big Table and AWS DynamoDB, among others), it’s no surprise that current Prometheus integrations include Kubernetes, CoreOS (via a Kubernetes stack called Tectonic), Docker and a range of other tools, VMs and container technologies. Digital Ocean, Boxever, KPMG, Outbrain, Ericsson, ShowMax and the Financial Times are all using Prometheus.
So what does an integration look like? Let’s dig in:

So, why would you want to do it this way?
It’s already possible to monitor a Docker service directly using Prometheus. So why add Fluentd in the middle? Well, what if you later decide to scale, and you want to monitor aggregate metrics from multiple containers? Or what if you want to route your Docker data to multiple destinations (and not just Prometheus)?
Configuring the Fluentd input plugin for Docker
The first thing you’ll want to do is get Fluentd installed on your host.
Once that’s done, and Fluentd is running (and can be stopped and started it’s time to install the plugin.
Add this line to your application’s Gemfile:
And then execute:
Or install it yourself as:
NOTE! you’ll need to be running Ruby >= v.2.0 for this plugin to install properly. We recommend using RVM to get the proper Ruby version installed.
Setting up Prometheus on a Docker Host
Once you have a Docker host up and running, you should install the precompiled Prometheus image using wget as follows:
And then start Prometheus server up:
Incidentally, you should be running Prometheus against the prometheus.yml that got installed when you installed fluent-plugin-prometheus. It looks like this:
You can easily test if your Prometheus server is up and running, by opening the urls exposed by Prometheus from a browser on another host.
http://your_Prometheus_IP:9090/metrics
This should show a page containing a lot of text-only results containing different performance metrics for Prometheus service.
You can also try:
http://your_Prometheus_IP:9090/graph
Pay attention to this, as we’ll use this later to query our Prometheus server given our directives.
Routing the data to a Prometheus instance
This is a matter of configuring your fluentd.conf or td-agent.conf with the appropriate directives to route the data correctly to Prometheus.
For our example today, you’ll want to edit it to do the following:
- Get all stdout commands entered within the Docker container.
- Route these – and send them – to your Prometheus server.
- Increment your docker_command_log metric as more commands are entered into your container.
First, open your td-agent.conf in a text editor:
Now, let’s look at the directives
These settings ensure that, as we are collecting console commands from our Docker container, we’re routing them to our Prometheus server, as a metric. The metric will be incremented as more Docker container commands are logged.
Once done, restart your Fluentd instance to take your new settings into account.
Next, start your Docker container, from which you will be logging console commands:
Finally, from within your Docker container, start entering commands. You can verify that Fluentd is picking up the commands by tailing td-agent.log in a separate window to verify the commands are working:

Querying your Prometheus Instance
Last, from our browser, we’ll query our Prometheus instance for the data we sent it from our Docker container.
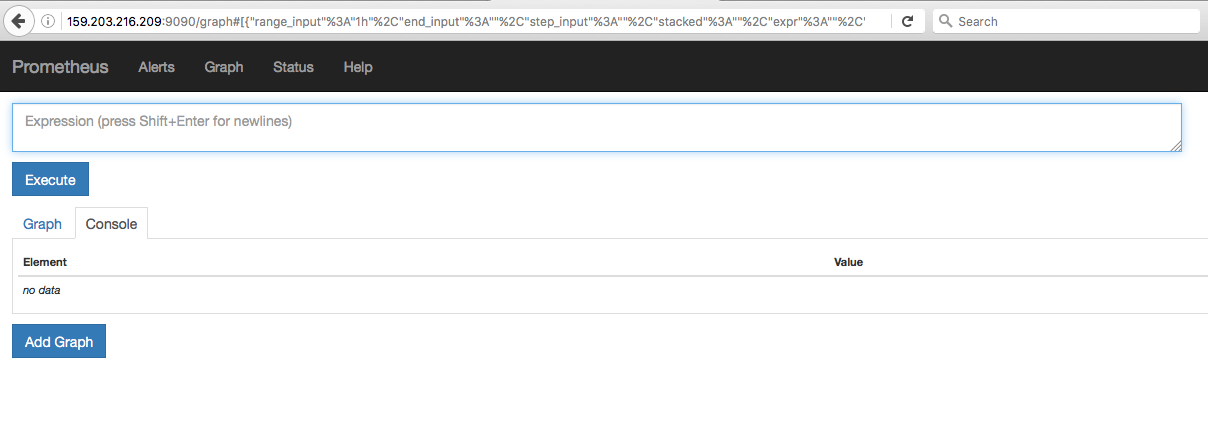
http://your_Prometheus_IP:9090/graph
You should see a web UI like the one shown here:

Enter the string docker_command_log in the expression editor, and click enter.

If everything is working, the expression editor should auto-complete your docker_command_log expression.
You should also see the metric in the graph populated with the number of commands you’d entered to the Docker container.
Entering more commands in your container and refreshing the browser should increment this number.
Next Steps
- You can learn more about Prometheus here: www.prometheus.io
- Would you like to build the easiest possible logging infrastructure you can? Get Fluentd!
- There are more than two hundred input, output, and other plugins here. Here you can see them sorted in descending order by popularity here: fluentd.org/plugins/all
- If you are interested in seeing the plug-ins by category, go here: fluentd.org/plugins
Last but not least, get Treasure Data (you can sign up for a 14 day trial at treasuredata.com ). You can always ask us if you need any help!
A great big shoutout goes to Muga Nishizawa and Sri Ramana for getting me unstuck at various times while preparing this tutorial. Thanks guys!
If you are interested in deploying Fluentd + Kubernetes/Docker at scale, check out our Fluentd Enterprise offering.